Publications IPH Magazine Revista IPH Nº18 How spatial syntax can help mitigate the effect of future pandemics in Brazil
- IPH Magazine Nº18
- The therapeutic garden
- Hospital Sul América and the modern design in health architecture
- RECOMMENDATIONS FOR PLANNING AND CARRYING OUT RENOVATION WORKS IN FUNCTIONAL HOSPITALS
- How spatial syntax can help mitigate the effect of future pandemics in Brazil
- A reflection on the impact of the Covid-19 pandemic on architecture and urbanism
- Floor covering of hospital floors: Case study of the vinyl blanket applied in a hospital in Salvador, BA
How spatial syntax can help mitigate the effect of future pandemics in Brazil
Dra. Maria Eleusa Montenegro, Dr. Paulo Afonso Cavichioli Carmona, Dra. Eliete de Pinho Araújo, Msc. Paulo César Galante Siqueira - Centro Universitário de Brasília - UniCEUB

Abstract
The main objective of this study was to establish the relationship between the spread of Covid-19 in Brazil and federal highways. The spatial syntax, a field of study of urbanism, was used to analyze the space and its relationship with people, being the level of integration of the pathways the dominant factor. In this research, the level of integration of the highways was allied to the density map of those infected with the virus, thus allowing us to analyze the relationship between the two. The development of this work occurred through the case study during the months of January, February and March of 2020, in Brazil. The study was done horizontally, because only the repetition of the facts could confirm or not a pattern of behavior. The number of infected and spatial characteristics were considered as primary data, and the overlap of these allowed us to establish the relationship between the parties. The study found that the most affected regions were those with more integrated highways. The proposed guidelines aim at the optimization of human and economic resources.
Keyword: spatial syntax; Covid-19; strategies against the pandemic; federal highways; preventive lockdown.
Introduction
The first half of 2020 will forever be marked in history: the first pandemic in the digital age. The application of georeferencing and technology has never been given so much importance, which allows us to know the exact location of an event, and all its effort so much has been directed to Covid-19. Knowing where it all started and how is its scattering pattern are frequent news in the newspapers. Perhaps the biggest question is how to eliminate the coronavirus, and here it is worth mentioning that the effort is multidisciplinary, but, regardless of the field of study, there are two main approaches: prevention and combat.
The combat has not been done only by those who are in the day to day dealing with the problem on the front line, being necessary to highlight the heroic acts of health professionals, but also by those who have made their contribution from within their laboratories, through research that allows a better understanding of this phenomenon and understanding of the disease. The situation that the world goes through is that of war, and victory is only possible when the enemy is understood. The search to understand the enemy has included professionals from the biological and health sciences, who seek to understand how the virus works, how its life cycle works, and other fronts; mathematicians and statisticians, who seek to form models that can predict the behavior and dispersion of the virus; psychologists, psychiatrists and sociologists, who seek to understand the effects of this social isolation in the human psyche; and so many other professionals. Geologists and urban planners have studied the georeferenced data collected that allow the study of the phenomena that, together with other fields of study, make it possible to understand patterns that can help in preventing the spread of this disease.
The Theory of Spatial Syntax was proposed by Bill Hillier and his collaborators at the University of London in the early 1980s (SABOYA, 2007). And although it is still considered to be something new scientifically, it is used with great effectiveness as a project tool of new cities and in the understanding of behavioral patterns. This branch of urbanism establishes that a phenomenon will only occur if it is possible that the agent can reach its destination, thus creating an event. The concept of social isolation (1), or even lockdown (2), has the same principle: once people stop interacting, the virus will not be able to spread, because the means of transmission has been eliminated.
It was possible to determine where it all started, Wuhan, China. As, today, much more than "where it began", society wants to know how it spreads and how we can combat it. The search for the vaccine or the medicine that will fight this virus is of great help, but it solves just the current problems. A new virus may not be defeated by the coronavirus vaccine or by the Covid-19 medicine, but it will exploit the same weaknesses found by this virus, spreading with the same ease. Despite the importance of a solution to the current pandemic, research should also analyze the factors that led to the successful dissemination of Covid-19. This work aims to contribute to future planning to avoid the situation currently experienced.
Development
Understanding the pattern of disease dispersion will allow knowledge and implementation of practices that prevent future pandemics. The spatial syntax is dedicated to the study of phenomena that occur due to the displacement through terrestrial pathways, allowing factors related to configuration to be measured mathematically and visualized in a clear, objective and impersonal way (SIQUEIRA, 2020). About the use of spatial syntax, Siqueira (2020, p. 36, highlights of the author) says:
When we look at the road system, we realize that some streets intersect; in this region where the roads intersect we call "knot". The theory of knots dates back to the end of the 19th century (ROSA 2012, p. 80) and studies topology, that is, studies the structure of objects without worrying about size, shape or geometry. From this information, we can then create a map that encodes the number of knots of each pathway. This map helps us understand how many other streets it interacts with. Reiterating what Saboya (2007) said about Spatial Syntax and the integration of pathways: "of the possible measures of syntactic analysis, the main one is the so-called integration". It is useful in predicting pedestrian and vehicle flows and understanding the logic of localization of urban uses and social encounters.
Although the virus initially spread through air passengers, once these passengers reached their destination, the spread of Covid-19 was made among people in their places of residence: homes, neighborhoods, cities and states. This work aimed to study land routes (main means of contact between cities), evaluating the relationship between federal highways in Brazil and the spread of the virus. Data on the evolution of the virus were made available by the Ministry of Health, which, in partnership with the Federal University of Rio Grande do Sul (RS. UFRGS, 2020), with ArcGIS software, developed the Coronavirus Panel, with all cases confirmed in Brazil between February 26 and April 30, 2020.
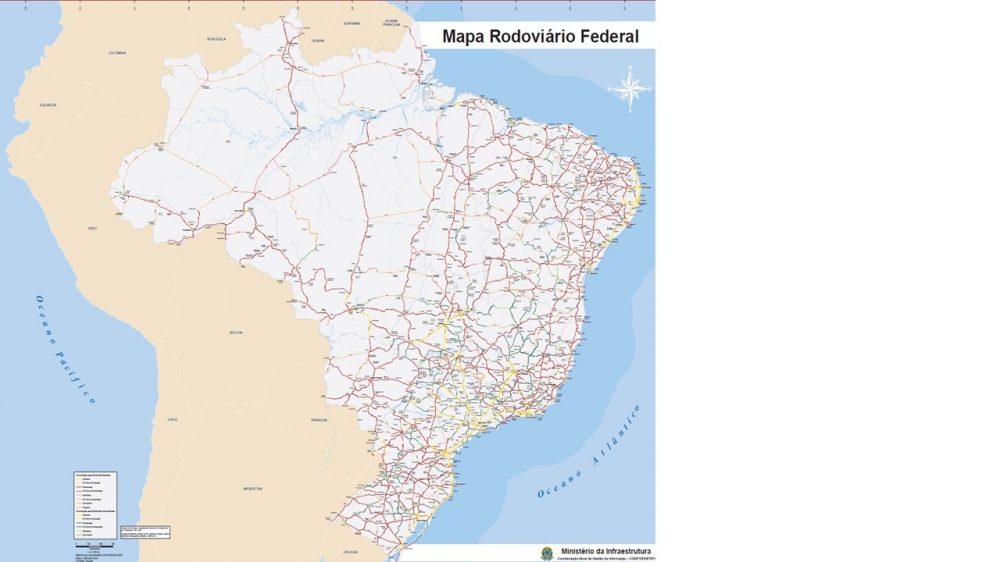
The study related the map created by UFRGS with the axial map3 federal highways, where the integration was evaluated to determine this relationship. The axial map was generated from the drawing of the highways (Map 1) in AutoCad software, and its analysis, in the Depthmap software. The criterion adopted was to observe in a visual way the relationship between the two maps, looking for situations in which the facts were repeated and could establish a pattern. The virus behaves dynamically, so the study evaluated the maps mentioned also dynamically, evaluating the dispersion per fortnight. The month of February 2020 was evaluated as a whole, because no relevant change was identified
in this period.
Map 1: Federal Highways of Brazil
Source: BRASILMINFRA (2020)
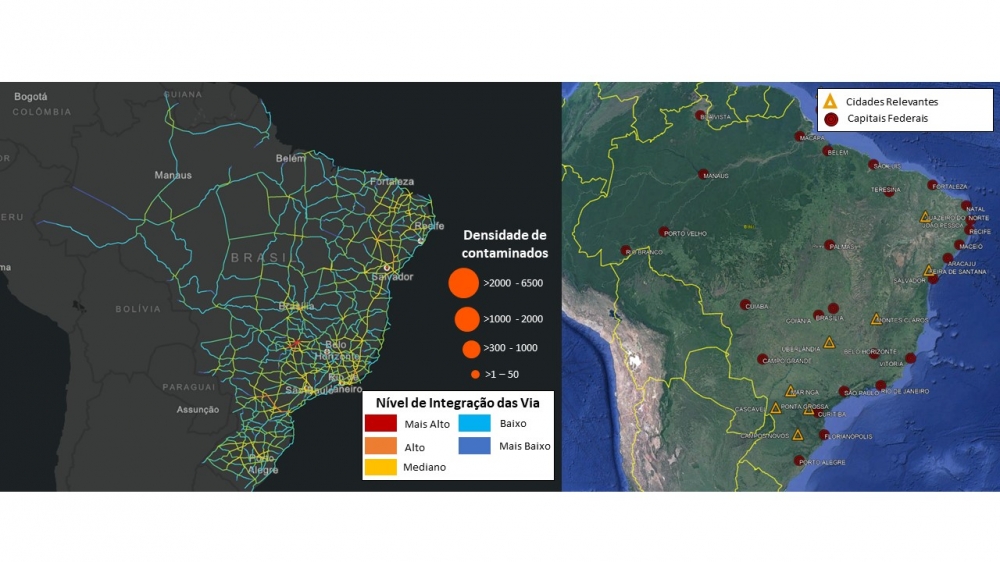
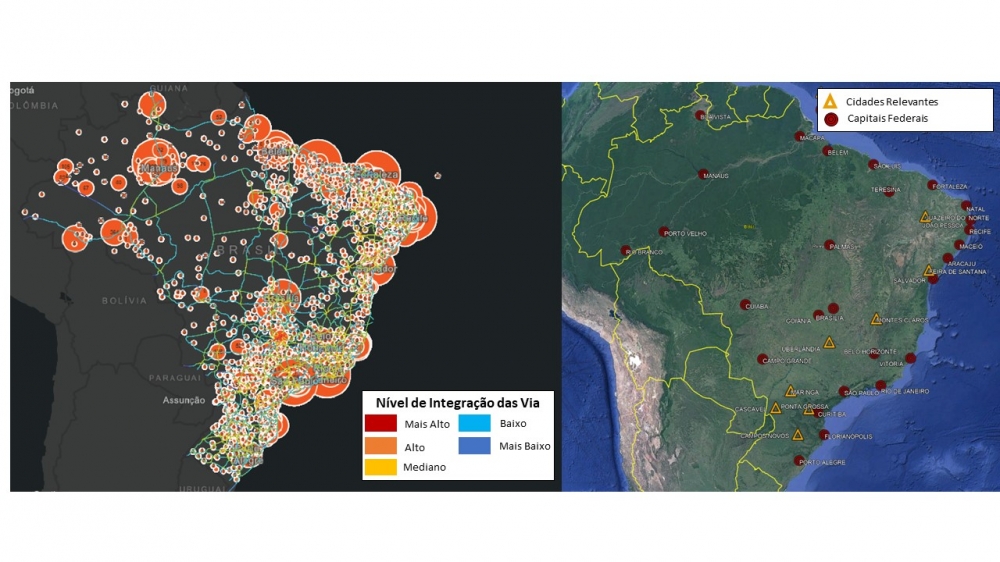
The axial map was studied with a focus on the integration (4) of one road with the other, that is, the existing facility to reach a certain location (Map 2). The integration map encodes each pathway by color, and its performance is demonstrated from the warmest colors (red) to the coldest (blue), in which a radius was used for the calculation of n=7. Highways with warmer colors represent greater integration; thus, the study tried to establish the relationship of the most integrated pathways as vectors of dissemination of the virus.
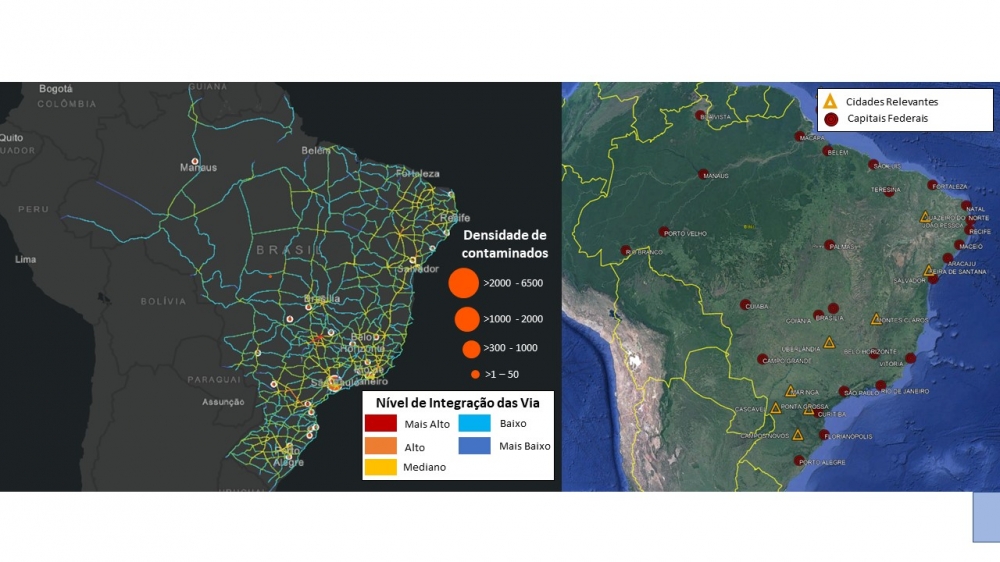
Map 2: Map Brazilian highways x Covid-19
Source: Author (2020)
By relating Maps 1 and 2, it can be observed that some cities act as integration centers, such as the cities of Juazeiro do Norte (CE), Feira de Santana (BA), Rio de Janeiro (RJ), São Paulo (SP), Uberlândia (MG), Brasília (DF), Montes Claros (MG), Porto Alegre (RS) and Cascavel (PR). In addition to these cities, it is possible to note that the stretch or intersection of some highways also has a better degree of integration, as can be seen in the stretches of BR-116 (Rio de Janeiro to Fortaleza); BR-376 (Maringá to Ponta Grossa); at the intersection between BR-232 and BR-116; and in Campos Novos (SC) region, with BR-282 to the west and BR-470 to the east. Unlike the virus, this analysis can be done in a static way, in which only the construction of a new highway would alter the indexes found. Thus, the analysis found here was maintained over time. The following is a view of the virus scatter maps allied to the integration map:
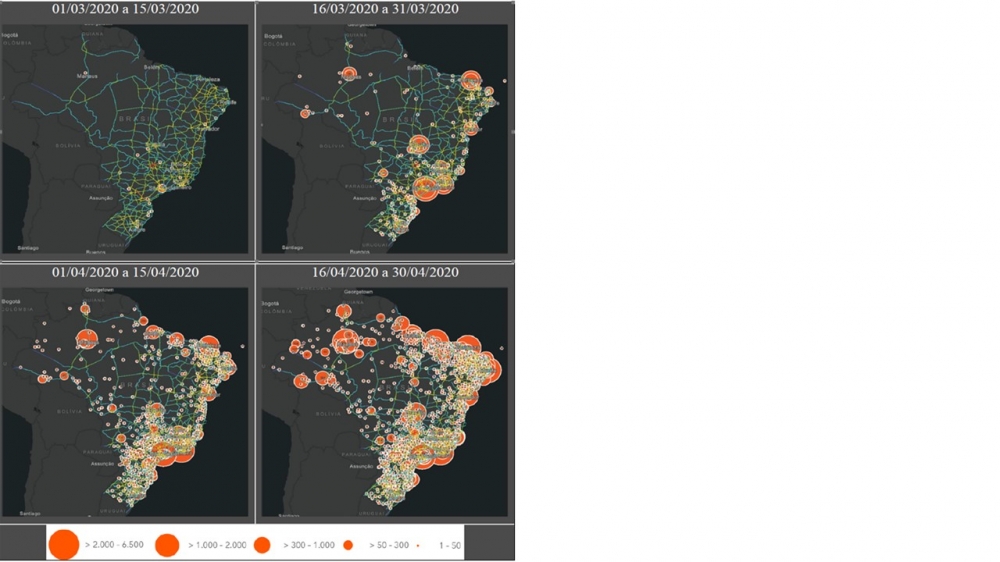
Table 1: Dispersion of confirmed cases of Covid-19 over time - 1º/3/2020 to 30/4/2020.
Source: Author, based on a map of UFRGS (2020)
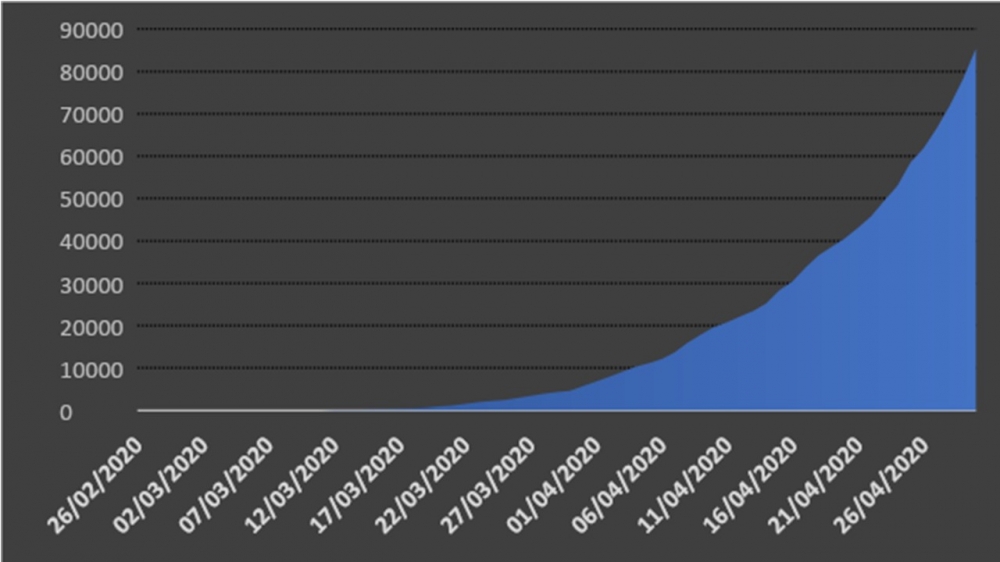
The maps in Table 1 show the rapid growth in the number of confirmed cases of Covid-19 in Brazil, a fact that is even clearer when analyzing Graph 1, which demonstrates it more accurately.
Table 1 - People infected with Covid-19
Source: Author (2020), based on data from BRASIL.MS (2020)
For a better understanding of this phenomenon, the map in Table 1 is shown individually and enlarged. Thus, the first half of March 2020 was studied, as shown in Map 3.
Map 3 - Map Brazilian highways x Covid-19 - 1º/3/2020 to 16/3/2020
Source: Author (2020)
Map 2 shows only a few cases recorded in February, in which infected cities have in common the large flow of passengers at their airports, which is the gateway to the virus in our country. It is noteworthy that the month of February was marked by a popular national event that lasts day and night, Carnival, greatly increasing the flow of passengers.
Map 3 depicts the first half of March 2020, in which the change is notorious, both in Map and Table 1. In this period, only the cities of São Paulo and Rio de Janeiro had a significant record, presenting 64 and 23 cases, respectively. It was from this moment, in which the virus began to become notorious in Brazil, that its diffusion between cities did not occur exclusively by air, but also by land.
The second half of March, shown by Map 4, shows the evolution more clearly, even enabling the creation of vectors that pointed to the direction of dissemination of Covid-19.
Map 4 - Map of Brazilian highways x Covid-19 contamination - 16/3/2020 to 31/3/2020
Source: Author (2020)
Map 4 shows a higher occurrence in Brazilian capitals, which reinforces the thesis that part of the spread occurred by land, since the capitals are interconnected by the federal highways, and the highways BR-116 and BR-101, which connect several coastal cities, from the north coast to the southern coast of the country, can be highlighted. Another highway evidenced by the map is BR-381, which connects Belo Horizonte to São Paulo, and BR-040, which connects Belo Horizonte to Rio de Janeiro. The roads mentioned have a high level of integration, thus reinforcing the idea that the most integrated highways facilitated the spread of the virus.
Still there is the fact that, among the capitals, the tourist cities had more expressive numbers of contamination. It is necessary to remember that the virus has an incubation period of up to 14 days (BRASIL.MS. FIOCRUZ,2020). Thus, Carnival and the school holiday period this year were of great contribution to the spread of Covid-19. This fact may have demonstrated a trend: the initial spread was mainly caused by tourism. In addition to tourism, regions of large industries and agricultural production also encourage the transit of people, in this case, people from small towns and rural areas tend to be contaminated by people who have been in large centers.
The month of March also marked the beginning of social isolation in almost all states of the federation, as shown in Table 2 (data taken from Decrees published by each Brazilian state in 2020):
Social isolation marked a time when the transit of people in cities and between cities was reduced to the minimum necessary. Thus, the next cases in this study showed little or no influence from people outside their cities or states, with the predominant participation of the local population of each city.
| Acre | 16/03/2020 | Maranhão | 30/03/2020 | Rio de Janeiro | 11/03/2020 |
| Alagoas | 18/03/2020 | Mato Grosso | 31/03/2020 | Rio Grande do Norte | 13/03/2020 |
| Amapá | 17/03/2020 | Mato Grosso do Sul | 16/03/2020 | Rio Grande do Sul | 01/04/2020 |
| Amazon | 23/03/2020 | Minas Gerais | 19/03/2020 | Rondônia | 17/03/2020 |
| Bahia | 16/03/2020 | Pará | 18/03/2020 | Roraima | 27/03/2020 |
| Ceará | 19/03/2020 | Paraná | 16/03/2020 | Santa Catarina | 23/03/2020 |
| Federal District | 19/03/2020 | Paraíba | 17/03/2020 | São Paulo | 13/03/2020 |
| Espírito Santo | 13/03/2020 | Pernambuco | 14/03/2020 | Sergipe | 16/03/2020 |
| Goiás | 13/03/2020 | Piauí | 23/03/2020 | Tocantins | 21/04/2020 |
Table 2 - Beginning of social isolation by Brazilian state
Source: Author (2020), based on Decrees of the states and territories
Although, by the end of March 2020, virtually all units of the federation had decreed social isolation as a measure of containment to the advance of Covid-19, due to the incubation period of the virus, the effects were felt only after the second half of April.
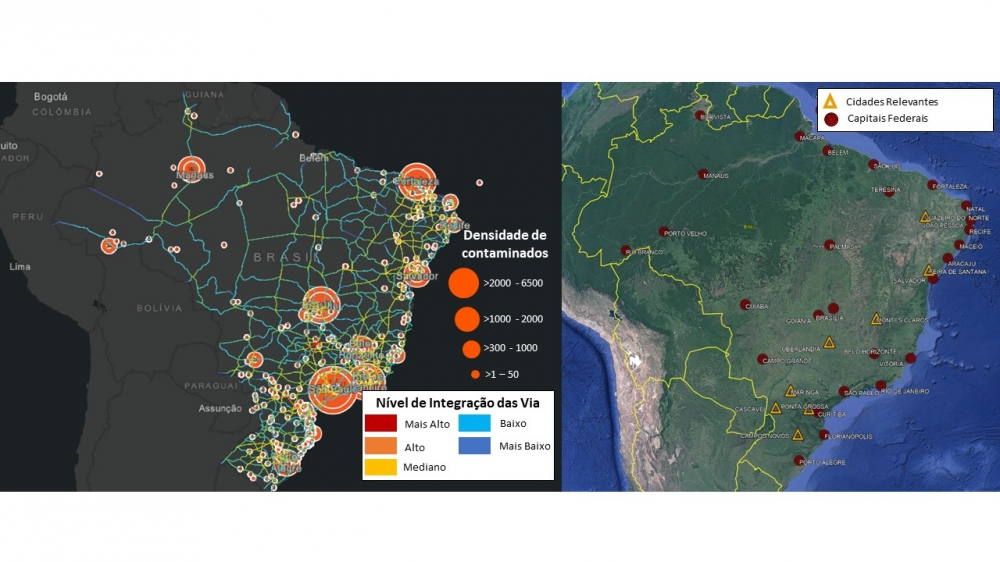
Map 5 - Map of Brazilian highways x Covid-19 contamination - 1st/4/2020 - 15/4/2020
Source: Author (2020)
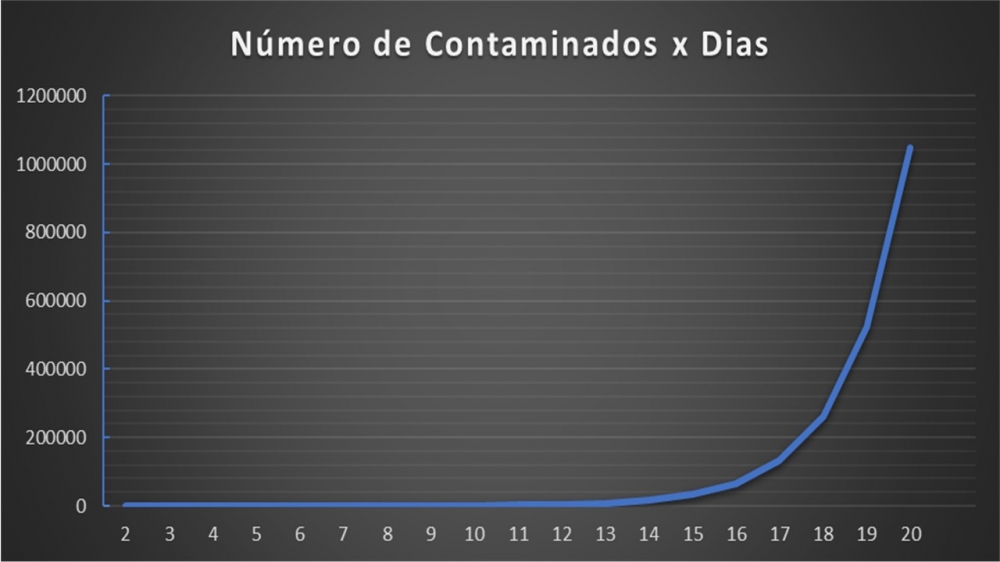
Map 5 already shows a very large number of infected cities, but the vast majority below 300 cases, as can be seen by the orange circles representing the density of contamination in the place. Virus contagion occurs exponentially (BRASIL.MS. FIOCRUZ, 2020), that is, each contaminated person transmits the virus to at least 16 people, as shown in Illustration 1.
Figure 1 - Progression of Covid-19 contamination
Source: BBC, 2020
Thus, two people contaminate four, and so on, generating an exponential series, as shown in Graph 2. After20 days, it is possible to reach 1,048,576 infected people.
Graph 2 - Number of infected people x days
Source: Author, 2020
Therefore, only one individual can be responsible for the contamination of 300 people in just under 18 days, making it very difficult to point a pattern to the high number of infected people. Despite the difficulties, it was noticed that the facts observed in Map 4 continue to be related to the dispersion of the disease. In addition to the facts listed in Map 4, it is possible to notice that the Covid-19 spreads radially in the capitals, with a higher occurrence in the nearest cities, which are on the highways with better level of integration. Although both BR-116 and BR-101 act as vectors of virus dissemination, it is perceived that BR-101 exerts more influence. The cities of São Paulo and Rio de Janeiro formed a major spreader of the disease, because large and important highways that depart from these major cities helped transmit the virus.
Map 5 also shows that Manaus, because it is isolated from other infected cities, in a future study, would be the best city to understand the behavior of the virus. This is due to the fact that its population has little contact with other regions, with little external influence and can be considered to have an isolated system. This fact nullifies what is known as the edge effect.
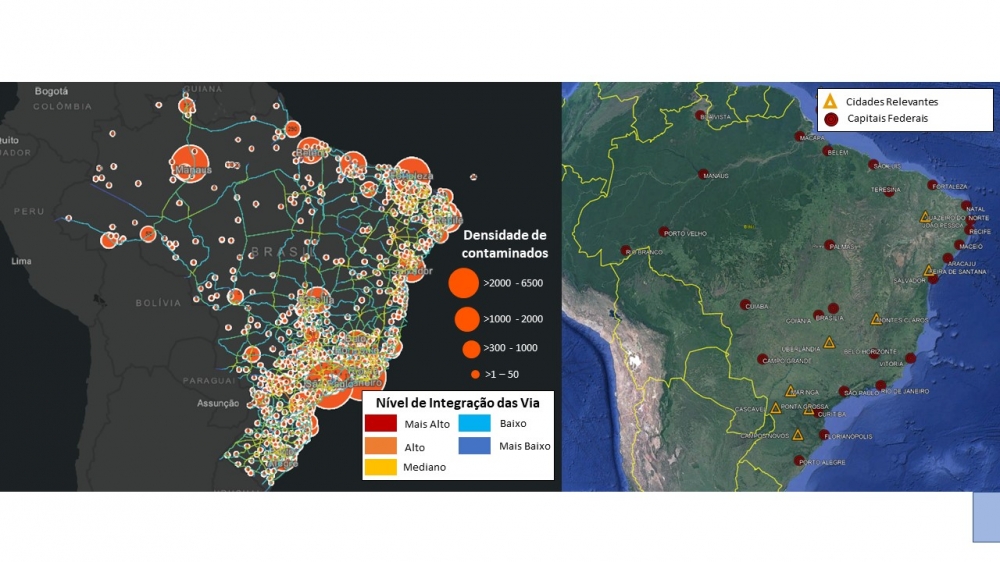
Map 6 - Map Brazilian highways x Covid-19 - 16/4/2020 to 30/4/2020
Source: Author (2020)
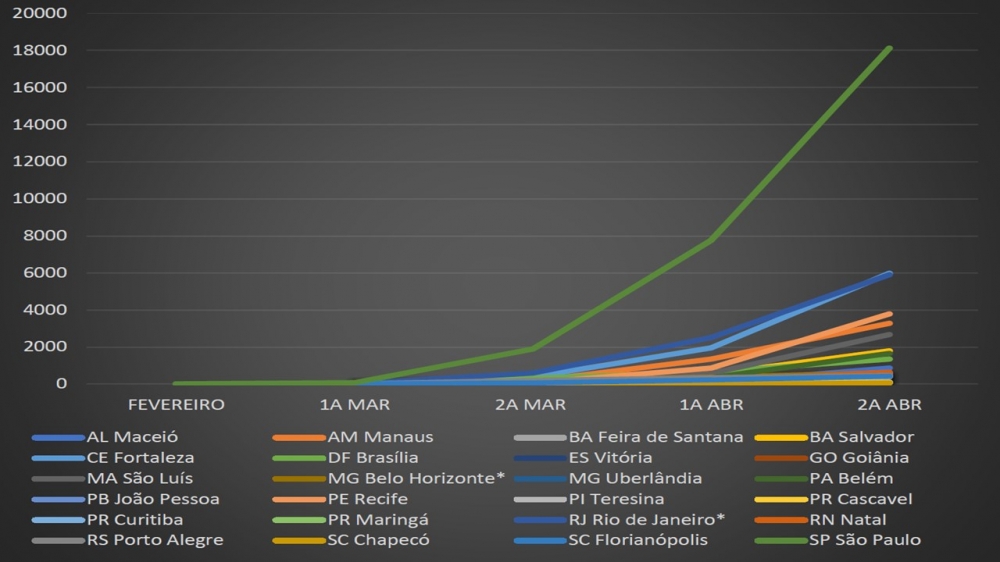
Map 6 already shows much of the national territory taken by the virus. Due to the confinement, the spread of the virus should occur almost without the influence of transportation through highways, or even by air. The dispersion became almost exclusively done by local agents. Moreover, it was possible to notice that the places that presented high numbers continued in an upward curve, especially the city of São Paulo. Graph 3 shows some of the major cities affected and their behavior during the period of this study.
Graph 3 - Major cities affected
Source: Author (2020), based on data from the Ministry of Health (BRASIL.MS, 2020)
Final considerations
The speed with which Covid-19 spread around the world showed the fragility of the world health system, leveling both the most affluent and most needy countries. The pandemic has not only caused a health crisis, but has had serious side effects, especially in the economy. The truth is that, in a pandemic, little can be done to change the world situation, but there are guidelines that can be implemented at borders to preserve the nation.
Until May 18, 2020, Brazil had a budget, from the Ministry of Health, destined to combat Covid-19 of R$ 24,167,950,734.00 (PRESIDENCY OF THE REPUBLIC, CONTROLADORIA-GREAL DA UNIÃO, 2020), and about 35% of this amount has been spent to date. The annual budget for Health, planned in 2019, for the year 2020, was of R$ 19.3 billion (EXAME MAGAZINE, 2019), that is, we had not even reached half of 2020 and the annual budget planned was already exceeded. The Covid-19 pandemic has had several effects, which can already be felt, with the economic and undersupply being the most noticeable, but much is still to come.
The work assumes that one must do everything possible to contain the advances of the virus, protecting life to the fullest. But the fact is that the situation experienced resembles a war. The planning is carried out reactively, always after the movement of the opponent. Once the battle is over, there will be several learnings for sure. Certainly, this will not be the last pandemic experienced in Brazil, and this was the central point of this study: to outline containment strategies for a possible new epidemic, not only to preserve life, but also to cause less impact in our country, especially in the economy. Although our focus was on finding solutions for future pandemics, this model is not limited only to this application. The solutions proposed here can be applied in vaccination campaigns, epidemics, as well as in further fields ox expertise, besides health. The points of greater integration point to the places where flow control can be more effective.
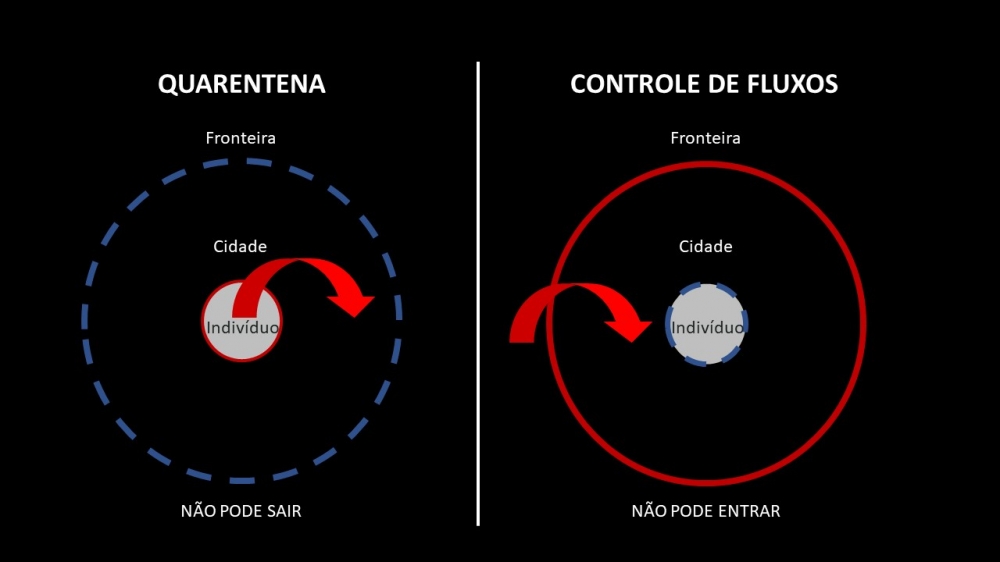
The study showed that highways and airports were the main diffusers of the virus. With this in mind, there are some observations about the strategies taken. Social isolation was necessary, but it has an inside-out view. In this study, it was observed that this view, in which the population was confined to their homes, tends to be partial, and does not consider the whole. At an early stage, the opposite tends to be more effective from the point of view of spatial syntax, as shown in Illustration 2, adopting a macro view of the situation.
Illustration 2 - Social isolation x Flow control
Source: Author (2020)
The proposed model is flow control, in which airports and strategic points of some highways were monitored, and only cities with a high degree of contagion suffered strategies, such as social isolation. In addition to the containment aspect of contagion, this would lead to a huge savings for the Union and the Federative Units. Today, resources are allocated as needed and, however much effort, they are always one step behind the problem. The change of strategy would cause resources to be allocated at fixed points, and those infected would be directed to the control points. This policy would also be beneficial in isolating those asymptomatic patients who are generally responsible for much of the spread of the disease. If another pandemic happens, this model will be much more productive and economical, establishing a strategy that will not only be momentary, but that can be used in several other emergencies.
The suggestion is the creation of screening sectors in airports, especially those that receive and offer international flights, especially in tourist cities, with rapid tests. In the case of contamination, within the airport itself, there should be a small hospital with capacity for hospitalization of patients, thus, the passenger would receive medical care until the restoration of his health. The study showed that using spatial syntax, especially the study of the integration of pathways, is beneficial to outline strategies on where to place control points. Let it be clear that the intent of this strategy is not the closing of borders, but the examination of those who comes through, in order to ensure health. The analysis of the axial map and the integration of the highways show that BR-101, BR-116, BR-376 and the departures of the cities of Brasília, São Paulo, Rio de Janeiro and Porto Alegre are paramount for the control of a pandemic. In the case of highways and cities, small health units could be built for the contaminated, near the inspection posts of the Federal Highway Police, or even have trailers prepared for this service, which could move as needed. These strategies would be much more effective and less impactful from a social point of view, enabling a much smaller
economic impact.
This study took into account only federal highways, but their deepening, including state highways and combining the level of integration of roads with statistical data of the flow of people, would further deepen the guidelines proposed here. The aim of this work was to suggest possible guidelines to be taken in a future pandemic, optimizing human and financial resources. Due to the great spread of the virus in Brazil, the points shown here would be of little efficacy at the present time and should be implemented preventively.
References
BBC. Contágio por coronavírus: o que é o viés matemático que dificulta o combate à pandemia de Covid-19, 19 de ago. 2020, Available at: https://www.bbc.com/portuguese/vert-fut-53822007. Access on Oct 18, 2021.
BRASIL.IO. Boletins informativos e casos de coronavírus por município por dia. 2020. Available at: https://brasil.io/dataset/covid19/caso/. Access on May 11, 2020.
BRASIL.MINISTÉRIO DA INFRAESTRUTURA. Mapa Rodoviário Federal. 2020. Available at https://infraestrutura.gov.br/rodovias-brasileiras.html. Access on May 10, 2020.
BRASIL.MS.FUNDAÇÃO OSWALDO CRUZ. Qual o tempo de incubação do novo coronavírus. 2020. Available at https://portal.fiocruz.br/pergunta/qual-e-o-tempo-de-incubacao-do-novo-coronavirus. Access on May 18, 2020.
______. Tendências atuais da pandemia de Covid 19: interiorização e aceleração da transmissão em alguns estados. 2020. Available at http://revistafitos.far. fiocruz.br/fitos/index.php/noticias/tendencias-atuais-da-pandemia-de-covid-19-interiorizacao-e-aceleracao-da-transmissao-em-alguns-estados. Access on May 19, 2020.
MEDEIROS, V. Urbis Brasília e ou sobre cidades do Brasil: inserindo assentamentos urbanos do país em investigações configuracionais comparativas. 520 f. Tese (Doutorado) - Curso de Arquitetura e Urbanismo, Faculdade de Arquitetura e Urbanismo, Universidade de Brasília, Brasília, 2006. Available at https://repositorio.unb.br/handle/10482/1557. Access on April 30, 2019.
MINAS GERAIS. Decreto nº 47.890, de 19 de março de 2020. 2020. Available at https: //www.legisweb.com.br/legislacao/?id=391039. Access on May 18, 2020.
PRESIDÊNCIA DA REPÚBLICA (Brasil); CONTROLADORIA-GERAL DA UNIÃO - CGU. Portal da Transparência do Governo Federal, Enfrentamento da Emergência de Saúde Pública de Importância Internacional decorrente do Coronavírus. 2020. Available at http://www.portaltransparencia.gov.br/orcamento/despesas?paginacao Simples=false&tamanhoPagina=&offset=&direcaoOrdenacao=asc&de=2020&ate=2020&acao=21C0&colunasSelecionadas=ano%2CorcamentoAtualizado%2CpercentualRealizado%2CorcamentoRealizado&ordenarPor=ano&direcao=desc. Access on May 16, 2020.
REVISTA EXAME. GOVERNO diz que orçamento de 2020 excede o mínimo em Saúde e Educação. Exame. 30 de ago., 2019. Available at https://exame.abril.com.br /economia/governo-diz-que-orcamento-de-2020-excede-o-minimo-em-saude-e-educacao/. Access on May 16, 2020.
RS. UFRS. Painel do Coronavírus (Covid-19) - casos confirmados por municípios brasileiros. 2020. Available at https://ufrgs.maps.arcgis.com/apps/ opsdashboard/index.html#/03fb27b449a74927a6e4033187b251f2. Access on May 12, 2020.
SABOYA, R. Sintaxe Espacial. 2007. Available at https://urbanidades.arq.br/? p=33. Access on May 4, 2019.
SIQUEIRA, P. O espaço urbano e o crime: um estudo de caso da relação entre os crimes contra transeuntes em Regiões Administrativas do Distrito Federal. 2020. 160 f. Dissertação (Mestrado em Arquitetura e Urbanismo) - Instituto CEUB de Pesquisa e Desenvolvimento, UniCEUB, Distrito Federal.
TOCANTINS. Decreto nº 6.083, de 27 de março de 2020. 2020. Available at https:// www.legisweb.com.br/legislacao/?id=392927. Access on May 18, 2020.
Eliete de Pinho Araújo. Master in Urban Planning and Technology from FAU-UnB. PhD in Public Health from FIOCRUZ. Post-doctorate from the University of Coruña. Professor of Architecture and Urbanism at UniCEUB. Coordinator of the Master's degree in Architecture and Urbanism at ICPD-UniCEUB. Professor of the Specialization Course in Architecture of Health Systems at UCB and of the Specialization Course in Health Management and Hospital Administration at Faculdade Laboro.
Maria Eleusa Montenegro. Master and PhD in Education from UNICAMP/SP (Psychology of Education). Post-doctorate from the Faculty of Education of the University of Brasilia (UnB). Retired professor from the Faculty of Education of the Federal University of Goiás (UFG). Professor of Teaching Higher Education and Social Commitment for the Master's degree in Architecture and Urbanism and bachelor's degrees at the University Center of Brasília (UniCEUB).
Paulo Afonso Cavichioli Carmona. Post-doctorate from Università del Salento, Italy. PhD in Urban Law from PUC/SP. Master's degree in Urban Law from PUC/SP. Professor of Law of the Master's/Doctorate Program of Law and the Master of Architecture and Urbanism of UniCEUB. Professor of Administrative and Urban Law of the Specialization Courses of the Higher School Foundation of the Public Prosecutor's Office of the Federal District and Territories (FESMPDFT).
Paulo Cesar Galante Siqueira. Master in Architecture by the University Center of Brasilia (UniCEUB), with focuses on City and Housing and research line in City and Urban Infrastructure. As an architect, he works with residential, commercial and acoustic projects. As an urban planner, he works in feasibility studies, infrastructure and allotment. He is the founder and director of the company A4D Arquitetura e Engenharia Ltda. E-mail: paulocgalante@a4d.arq.br.
Notas de rodapé
(1) Social isolation: stay far enough away from other people so the coronavirus - or any pathogen - can't spread. That's why establishments, schools and universities were closed, and events ended up cancelled. The Ministry of Health recommends keeping a distance of 2 meters away from other people
(UNIFESP, 2020).
(2) Lockdown - Mandatory measurement - It uses the state force. Lockdown means, specially, to cease dislocations. The idea is to prevent people flow and, therefore, prevent them to meet. One of its consequences is economic shut down (UNIFESP, 2020).
(3) Map axial: is the form of configurational representation that reveals the accessibility of the existing plot through a chromatic scale, grayscale or line thickness. This accessibility may or may not correspond to actual flows, with a view to the convergence of different variables (including paving types, the existence of magnets, political crises, etc.). (MEDEIROS, 2006, p. 507).
(4) Integration: possible measures of sintactic analysis, the main one is the so-called "Integration". It is useful in predicting pedestrian and vehicle flows and understanding the logic of localization of urban uses and social encounters (SAVOY, 2007).
Share


Send by e-mail: